

Part 1 of 5 — Beginner friendly
Let me tell you a story about a Detective.
Sherlock Holmes never walks into a crime scene and starts guessing. He doesn't say "it was probably the butler" and call it done. He looks. He observes. He notices the mud on the shoes, the cigarette stub, the clock stopped at 11:47. Only after he's observed everything does he form a theory.
EDA is what Sherlock does before naming a suspect. Your dataset is the crime scene. Your ML model is the theory. You don't build the theory until you've studied the scene thoroughly.
Most beginners skip this step. They load data, run a model, get 90% accuracy, feel great, and ship it. Three weeks later the model breaks in production and nobody knows why.
That failure almost always traces back to one thing: they never looked at their data properly.
What is EDA?
EDA stands for Exploratory Data Analysis. It's the process of examining, understanding, and summarising a dataset before you train any model. Think of it as your first conversation with the data — you're not asking it to predict anything yet. You're just getting to know it.
The real-world example:
Imagine a doctor who skips the examination and jumps straight to prescribing medicine. They don't check your blood pressure, don't run tests, don't ask about symptoms. Dangerous, right? EDA is the medical examination. Your model is the prescription. Don't prescribe before you examine.
The term was coined by statistician John Tukey in 1977. His insight was simple but radical: stop assuming things about data. Let the data tell you its own story first.
The flow looks like this:

The EDA mindset
Before writing a single line of code, ask these 4 questions about any new dataset:
-
What is this Data ?
What does each column mean in real life ?
Don't assume - read the data dictionary. - What is the quality ? Are there missing values? Duplicates? Wrong data types? Values that look like errors?
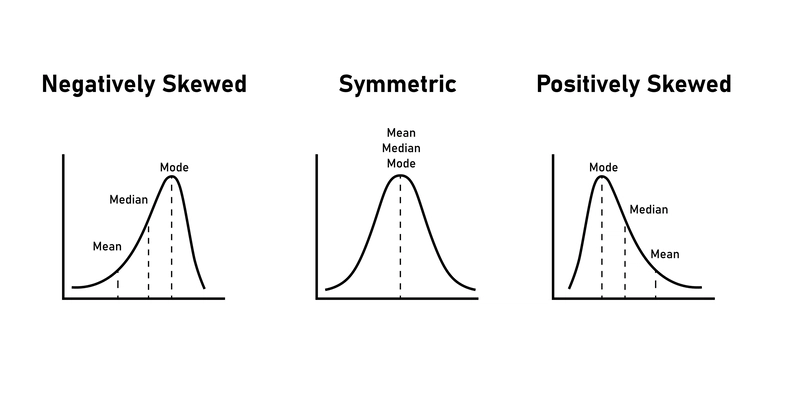
- What are the distributions What does each feature look like? Skewed? Balanced? Are there obvious outliers?
- What are the relationships Which features are correlated with each other? Which features predict the target?
Three pillars of EDA
Summary Statistics: Getting the
vitals(Mean, Median, Mode, Standard Deviation). If the terms are new for you don't worry, you will learn more on this in next parts of this series.Data Visualization: Turning rows of numbers into charts (Histograms, Scatter plots, Box plots) to see what the human eye misses in a spreadsheet.
Data Cleaning: Identifying missing values, duplicate entries, or
garbagedata that could skew your results.
Why is EDA Crucial for Machine Learning?
You’ve probably heard the phrase Garbage In, Garbage Out. This is the primary reason we do EDA. Even the most sophisticated algorithm will fail if the data it learns from is flawed.
A. Ensuring Data Quality
EDA helps you find the weirdness. Is there a person in your dataset who is 250 years old? Is there a house with 0 bedrooms? EDA catches these anomalies before they confuse your model.
B. Feature Selection & Engineering
By looking at correlations, you can see which variables actually matter. If you’re predicting house prices and find that the color of the front door has zero correlation with the price, you can drop that noise and make your model leaner and faster.
C. Testing Assumptions
Many ML models (like Linear Regression) rely on specific assumptions—for example, that your data follows a Normal Distribution. EDA allows you to check these assumptions. If your data is heavily skewed, you’ll know you need to transform it first.
D. Building Intuition
As a data scientist, you need to be the bridge between the raw data and the business stakeholders. EDA gives you the story behind the numbers, allowing you to explain why a model might be making certain predictions.
The Cost of Skipping EDA
Skipping this step is a recipe for disaster. Without EDA:
1. Biased Models: You might train a model on data that isn't representative of the real world.
2. Overfitting: You might "learn" from outliers that are actually just data entry errors.
3. Wasted Time: You’ll spend weeks tuning a model only to realize the data was missing the most important variable all along.
Pro Tip: EDA isn’t a one-time chore; it’s an iterative process. You’ll find yourself coming back to it even after you’ve started building your models.
The dataset we'll use throughout this series
We'll use the Titanic dataset from Kaggle — one of the most famous datasets in data science. It's real historical data about passengers and crew who were aboard the RMS Titanic, which sank on April 15, 1912 resulting in the death of 1502 out of 2,224 passengers and crew — a widely used sample provided by Kaggle for the competition.
Here's what makes it perfect for EDA: it has missing values, mixed data types, categorical and numeric features, and a clear survival target to predict.
What's next?
In Part 2, we download the Titanic dataset from Kaggle and run our first 5-line EDA check. No complicated setup — you can run it directly in a free Kaggle notebook or google collab.
See you in Part 2! 👋


Top comments (0)