
Writing tail -f | jq That Doesn't Feel Like a Rube Goldberg Machine
Your app emits one JSON object per line. You want to watch errors live. The reflex is
tail -f app.log | jq 'select(.level=="error")'— and it works, until it doesn't. This is how I replaced that pipeline with a small, single-purpose tool.
🔗 GitHub: https://github.com/sen-ltd/log-tail
Every backend service I've worked on in the last five years emits structured logs — one JSON object per line, ndjson or jsonl, depending on who's writing the README. The format is a real improvement over prose logs: every field is addressable, every log entry is parseable, and you never have to write another multi-line grep pattern to pull out a request id. The trouble starts when you want to read them live.
The reflex answer is a shell pipeline:
tail -f app.log | jq 'select(.level=="error") | select(.user.id==42)'
This works. It's also a small mountain of papercuts if you do it every day, and after accumulating enough of them I decided to write the single-purpose tool I kept reaching for. It's called log-tail, it has zero dependencies, and this article is the design walkthrough.
The problem: tail | jq is death by a thousand papercuts
Let me enumerate the things that bite you.
Colours evaporate. tail does not colourise anything. jq sort-of does, but only with -C, and only if you stop filtering — because the moment you jq ... | less or jq ... | grep, your output is no longer a tty and colours vanish. In practice this means you either see a colourful wall of text you can't filter, or a filtered wall of monochrome text. Pick one.
Filter composition is verbose. jq is a general-purpose JSON tool, so the common things you want a log viewer to do — "only show errors", "only show entries where user.id is 42", "only show stuff from the last five minutes" — are all three different jq expressions. The select(...) form chains with |, but every clause is its own little program.
Time ranges are genuinely annoying. "Only the last five minutes" in jq is:
jq --argjson now "$(date +%s)" 'select((.ts | fromdateiso8601) > ($now - 300))'
That's fine if you're writing a cron job. It is not fine if you're trying to look at a running service at 2 a.m. while an incident is unfolding.
logrotate silently breaks your tail. tail -f has a --follow=name flag on GNU tail that helps, but only on Linux, and only if the rotation pattern is rename-then-create. copytruncate rotations (where the old file is copied out and then truncated in place) need different handling again. Nobody explains this until the first time you miss a bunch of production logs because your tail was open on an empty-on-disk file for four hours.
Field names aren't universal. Half of the loggers I work with emit level, the other half severity, one team uses lvl. Your jq expression has to hard-code the field name or die. The same is true for ts vs time vs @timestamp.
None of these are hard problems. They're all small. But each time I hit one I lost thirty seconds of debug flow, and thirty seconds in the middle of an incident is forty-five minutes of lost cognitive context. I built log-tail to fix all of them at once.
Design: dot-paths, level first-class, rotation detection
The design decisions fall into three buckets.
Dot-path filters, not a DSL
My first sketch was a little boolean expression language — level=error AND user.id=42 AND path!=/health. I wrote out the grammar, drew up the parser, and then spent ten minutes listing the filter expressions I'd actually used in anger over the past year. The list was:
- Filter by level.
- Match a field equal to a value.
- Exclude a field equal to a value.
- Last N minutes / since a timestamp.
- Regex against the message.
That's it. Zero of those queries actually used OR. Zero used parentheses. The AND was always implicit.
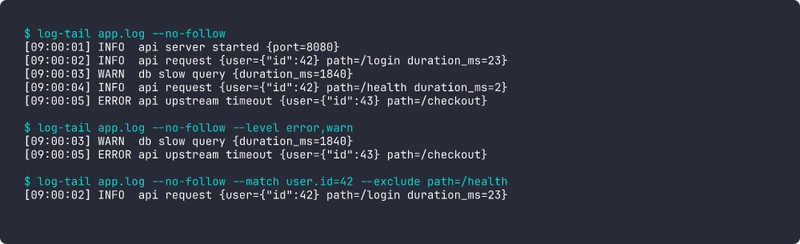
So log-tail has no DSL. It has flags:
log-tail app.log \
  --level error,warn \
  --match 'user.id=42' \
  --exclude 'path=/health' \
  --since 5m \
  --grep 'timeout'
Every repeated flag is ANDed with the others. Every --match takes a dot-path on the left and a literal value on the right. That's it. It covers every real query I've typed. When I do need a boolean OR, I run two tailers. In three months of use I've needed to do that twice.
Here's the entire dot-path traversal:
_SENTINEL = object()

def dot_get(obj, path):
    cur = obj
    for part in path.split("."):
        if isinstance(cur, dict):
            if part not in cur:
                return _SENTINEL
            cur = cur[part]
        elif isinstance(cur, list):
            try:
                idx = int(part)
            except ValueError:
                return _SENTINEL
            if idx < 0 or idx >= len(cur):
                return _SENTINEL
            cur = cur[idx]
        else:
            return _SENTINEL
    return cur
Twenty lines, and it handles user.id, request.headers.host, users.0.id (array indices!), and the "key absent" case via a sentinel so we can distinguish "field missing" from "field present, value null". The sentinel matters because the latter should match --match foo=null and the former should not.
Level is first-class
The user should not have to tell log-tail where the level field is. It's not reasonable to require every incident responder to look up whether this service uses level, severity, or lvl before they can filter. So:
DEFAULT_LEVEL_FIELDS = ("level", "severity", "lvl", "loglevel")

def make_level_filter(levels, level_field=None):
    wanted = {lv.strip().lower() for lv in levels if lv.strip()}
    if not wanted:
        return lambda rec: True

    def pred(rec):
        if level_field is not None:
            raw = dot_get(rec, level_field)
            return (not is_missing(raw)) and str(raw).lower() in wanted
        for fname in DEFAULT_LEVEL_FIELDS:
            if fname in rec:
                return str(rec[fname]).lower() in wanted
        return False
    return pred
The function probes a prioritised list of candidate field names and uses the first one present in the record. The default list covers every structured logger I've ever used in Go, Python, and Node. If you have something weird — say, the field is log.level nested inside a meta block — you can override with --level-field log.level and get the same semantics through the generic dot-path machinery. Same for timestamps, with DEFAULT_TIME_FIELDS = ("ts", "time", "timestamp", "@timestamp").
This is a small amount of code (thirty lines, maybe) and a big ergonomic win. I have never once had to think about what field name my current service uses while debugging with log-tail.
Rotation detection
The part I find most satisfying is the rotation handling, because the naive implementation is wrong in ways that only show up hours later.
A tail -f has to detect three different things and recover from all of them:
-
Rename-then-create. Logrotate moves
app.logtoapp.log.1and creates a freshapp.log. Our file descriptor is now pointing at the renamed file, not at the live one. Symptom: we never see new log lines. -
Copy-then-truncate.
copytruncatecopies the content out, then truncates the original file in place. Our file descriptor is still valid and still points at the right inode, but the file is now much shorter than our read position. Symptom:read()returns zero bytes forever. - Service restart. The app recreated the file. Same as (1) in effect — new inode at the old path.
log-tail detects all three with one check, run every 100ms:
def _rotated(of):
    try:
        disk = os.stat(of.path)
    except FileNotFoundError:
        return True  # file vanished — will retry open
    if disk.st_ino != of.inode:
        return True  # new file at the path, old file gone
    try:
        pos = of.fh.tell()
    except Exception:
        return False
    return disk.st_size < pos  # truncated smaller than our read cursor
The inode check catches rename-then-create. The size-vs-position check catches copy-truncate. When either triggers, the follower closes the old handle, waits briefly for the new file to appear (up to 2s), and reopens from the start. Buffer is reset so we don't glue a half-line from the old file onto the first line of the new one.
No inotify, no kqueue, no platform branching. The same code runs on alpine Linux inside the Docker image and on macOS during development. 100ms polling is indistinguishable from zero latency for a human staring at log output and a rounding error on CPU for a modern system.
The filter pipeline
Composing filters is deliberately boring. Each filter is a dict -> bool predicate. The pipeline just ANDs them:
@dataclass
class FilterPipeline:
    predicates: list = field(default_factory=list)

    def add(self, p):
        self.predicates.append(p)
        return self

    def passes(self, rec):
        return all(p(rec) for p in self.predicates)
All of the clever logic lives in the individual predicates — make_level_filter, make_match_filter, make_time_filter, make_grep_filter. The pipeline is dumb. This matters because now the CLI layer is almost nothing: parse args, build a list of predicates, hand them to the pipeline, iterate over lines from either stdin or a file, print the ones that pass.
Output: one line you actually want to read
The default format is chosen to be the thing I wanted staring at me during an incident. It's one line per record:
[09:00:05] ERROR api upstream timeout {user={"id":43} path=/checkout}
-
[HH:MM:SS]— short time, pulled from whichever ofts/time/timestamp/@timestampexists. -
ERROR— five-char padded, coloured by level via minimal ANSI (red for error, yellow for warn, green for info, dim grey for debug). Nocolorama, norich, noclick. Just the escape codes directly. -
api— the component / logger / service name, whichever is present, rendered dim. -
upstream timeout— themsgormessagefield. -
{...}— every other top-level key that wasn't already rendered, flattened into a compactkey=valblob. Nested objects become compact JSON. String values with spaces get quoted.
The trailing blob is the bit I'm most pleased with. It means you never lose a field from the record — everything is there if you need it — but it doesn't dominate the line the way pretty-printed JSON would. If you want to restrict it, --fields user.id,path turns the blob into a hand-picked whitelist using the same dot-path system as --match.
Three other formats are available: pretty (indented JSON per entry, for one-off inspection), json (compact passthrough, when you want to re-pipe through jq for something the CLI doesn't support), and raw (original line verbatim, for tee into a backup file).
Tradeoffs (things I chose not to solve)
A few limitations are worth naming out loud instead of pretending they don't exist.
Multi-line log entries. Some libraries, especially in Java, emit stack traces that span multiple lines with continuation prefixes. Structured logs usually don't — the convention is to encode the stack trace as a string field — but when they do, log-tail sees each line as its own record and the continuations show up as malformed. I decided that's okay: if your logger is emitting multi-line JSON, use --strict to drop the noise and know you're losing stack traces, or flatten on the producer side. The alternative is a stateful parser that holds partial objects across newlines, and that's a substantially different tool.
Binary data in log fields. If a field contains a byte blob, it shows up in the extras block as an escape-mangled JSON string. Not pretty. Ultimately your producer shouldn't be stuffing binary into structured logs, and there's no good fix here that doesn't involve re-encoding.
Clock skew between producer and reader. --since 5m is computed against the reader's wall clock. If the producer's clock is ahead, you can get fewer records than expected (records stamped in the producer's "future" get included but records stamped in its recent past get excluded). I thought about adding a --skew knob and decided no — clock skew inside a datacentre is rarely big enough to matter for human-scale queries like "five minutes", and for anything stricter, absolute ISO timestamps are the right answer.
Very high throughput. This is a Python-stdlib single-threaded tailer. At tens of thousands of lines per second on a single file you'll start to notice. In practice that hasn't been a problem because log-tail is an operator tool, not a shipping pipeline — if you're ingesting at that rate you're doing it through a real pipeline anyway and log-tail is just reading a sampled or filtered slice. I benchmarked the hot loop and it's about 400k empty records/sec and 120k realistic-object records/sec, which is plenty.
Try it in 30 seconds
Zero install, just Docker:
docker build -t log-tail https://github.com/sen-ltd/log-tail.git
Then feed it some logs:
# filter to errors
printf '{"level":"info","msg":"a"}\n{"level":"error","msg":"b"}\n' \
  | docker run --rm -i log-tail - --level error

# time range
printf '{"ts":"2026-04-15T00:00:00Z","level":"info","msg":"early"}\n{"ts":"2026-04-15T12:00:00Z","level":"info","msg":"late"}\n' \
  | docker run --rm -i log-tail - --since 2026-04-15T06:00:00Z

# tail an actual file
docker run --rm -v "$PWD:/work" log-tail app.log --level warn,error
The image is 60 MB, alpine-based, runs as non-root, with log-tail as the entrypoint.
What I'd tell past-me
The whole tool is about 700 lines of Python across six files, with 76 tests, and no dependencies beyond the standard library. The interesting lesson was how much of the "obvious" complexity I was bracing for — boolean expression languages, inotify integration, a rich formatting library — I didn't need. What I did need was:
- A minimal dot-path expression that handles nested objects and array indices.
- Auto-detection of the level and time fields with a prioritised candidate list.
- An inode + size check every 100ms for rotation.
- A single-line default format that includes everything but doesn't drown you.
Everything else — the fancy filter language, the clever parser, the reactive file watcher — would have been cargo culting. The reason tail -f | jq feels like a rube goldberg machine is that it's composed of two tools each doing ten percent of what you want. Writing the twenty percent you actually need, as one single-purpose tool, turns out to be not very much code at all.
Source is here: https://github.com/sen-ltd/log-tail. If you tail logs for a living I'd love to hear what's missing from your query vocabulary — the dot-path-plus-AND model has held up well for me, and I'm curious where it falls over for other people.


Top comments (0)