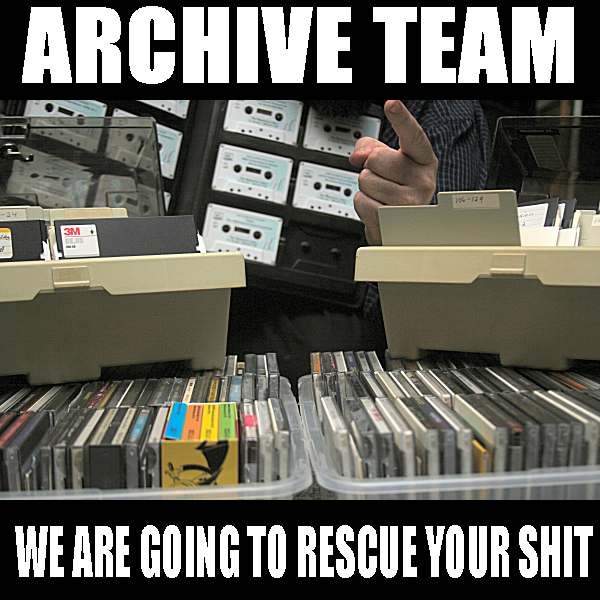
Formed in 2009, the Archive Team (not to be confused with the archive.org Archive-It Team) is a rogue archivist collective dedicated to saving copies of rapidly dying or deleted websites for the sake of history and digital heritage. The group is 100% composed of volunteers and interested parties, and has expanded into a large amount of related projects for saving online and digital history.
History is littered with hundreds of conflicts over the future of a community, group, location or business that were "resolved" when one of the parties stepped ahead and destroyed what was there. With the original point of contention destroyed, the debates would fall to the wayside. Archive Team believes that by duplicated condemned data, the conversation and debate can continue, as well as the richness and insight gained by keeping the materials. Our projects have ranged in size from a single volunteer downloading the data to a small-but-critical site, to over 100 volunteers stepping forward to acquire terabytes of user-created data to save for future generations.
The main site for Archive Team is at archiveteam.org and contains up to the date information on various projects, manifestos, plans and walkthroughs.
This collection contains the output of many Archive Team projects, both ongoing and completed. Thanks to the generous providing of disk space by the Internet Archive, multi-terabyte datasets can be made available, as well as in use by the Wayback Machine, providing a path back to lost websites and work.
Our collection has grown to the point of having sub-collections for the type of data we acquire. If you are seeking to browse the contents of these collections, the Wayback Machine is the best first stop. Otherwise, you are free to dig into the stacks to see what you may find.
The Archive Team Panic Downloads are full pulldowns of currently extant websites, meant to serve as emergency backups for needed sites that are in danger of closing, or which will be missed dearly if suddenly lost due to hard drive crashes or server failures.



 Light
Light Dark
Dark