

From raw GTFS files to a live dashboard — batch, streaming, and CI/CD all on GCP free tier
The Problem
Hong Kong runs one of the world's most complex and efficient public transport networks. MTR heavy rail, Light Rail, over 700 bus routes, trams, and ferries all coexist in a city of 7.5 million people. But the raw data behind all of this — GTFS feeds, MTR open data CSVs, real-time schedule APIs — sits scattered across government portals in formats that are nearly impossible for the public to actually use.
I wanted to answer a few simple questions:
- Which stops and routes carry the most traffic?
- How does service differ between weekdays and weekends?
- When does the first and last bus run on each route?
- How do the MTR and bus networks complement each other geographically?
- What does live MTR train activity look like, right now?
This project — HK Transit Pulse (香港交通脈搏) — is my answer. It's an end-to-end data engineering pipeline that ingests, transforms, and visualises Hong Kong public transport data, with a batch pipeline running daily and a streaming layer updating every minute.
Live dashboard: https://hk-transit-pulse-fclvz6lara-de.a.run.app
The Stack
Before diving in, here's what I used and why:
| Layer | Tool | Why |
|---|---|---|
| Orchestration | Bruin | Unified Python + SQL pipeline in one tool |
| Infrastructure | OpenTofu | Open-source Terraform, reproducible IaC |
| Data Lake | Google Cloud Storage | Simple, cheap raw zone |
| Data Warehouse | BigQuery | Serverless, columnar, free tier generous |
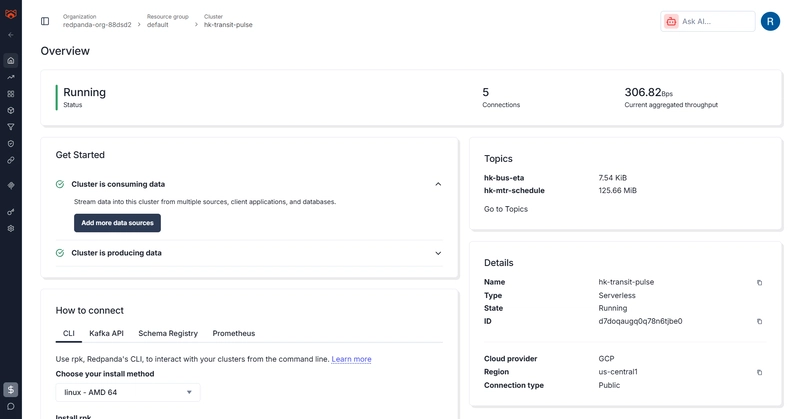
| Streaming | Redpanda Cloud | Kafka-compatible, no ZooKeeper, free tier |
| Dashboard | Streamlit | Pure Python, no frontend skills needed |
| Deployment | Cloud Run | Serverless containers, scales to zero |
| CI/CD | GitHub Actions + WIF | Keyless auth, no service account keys |
| Scheduling | Cloud Scheduler | Trigger Cloud Run Jobs on a cron |
Everything runs on GCP free tier.
Architecture

The full pipeline splits into two tracks:
Batch (daily at 06:00 HKT):
Cloud Scheduler → Cloud Run Job (Bruin) → GCS → BigQuery (raw → staging → marts)
Streaming (every minute):
Cloud Scheduler → producer Cloud Run Job → MTR API → Redpanda → consumer Cloud Run Job → BigQuery streaming
Both tracks converge at the Streamlit dashboard, which queries BigQuery directly.
GitHub Actions handles CI/CD: push to main builds Docker images, pushes to Artifact Registry, and deploys the dashboard and batch job.
Data Sources
HK Transport GTFS Static
GTFS (General Transit Feed Specification) is the open standard for public transport schedules. Hong Kong's GTFS feed — published at data.gov.hk — covers KMB buses, CTB/NWFB Citybus, trams, and ferries. It's a ZIP of text files: routes, stops, trips, stop times, and calendar.
One important caveat: MTR does not publish GTFS. Trip-level data for the heavy rail network is not publicly available. So for the MTR, I used their Open Data portal which publishes CSV files for station lists, fares, and Light Rail routes.
MTR Open Data
Four CSVs from opendata.mtr.com.hk:
- mtr_lines_stations — Heavy rail line and station data
- mtr_bus_stops — MTR feeder bus routes and stops
- mtr_fares — Station-to-station fare table
- mtr_light_rail_stops — Light Rail routes and stops
MTR Schedule API
Real-time train arrival predictions from rt.data.gov.hk. Used exclusively for the streaming layer — polled every minute and pushed to Redpanda.
The Pipeline in Detail
Orchestration with Bruin
Bruin is a modern data pipeline framework that lets you define Python ingestion scripts and SQL transformation assets under one orchestrator. This was my first time using it — it was chosen as the sponsor tool for DE Zoomcamp 2026.
The pipeline structure looks like this:
bruin/
└── assets/
    ├── ingestion/
    │   ├── ingest_gtfs_static.py
    │   └── ingest_mtr_csv.py
    ├── staging/
    │   ├── stg_stops.sql
    │   ├── stg_routes.sql
    │   └── ...
    └── marts/
        ├── mart_stops_ranked.sql
        ├── mart_peak_hour_analysis.sql
        └── ...
Each asset declares its dependencies and type in a header comment block. Bruin resolves the DAG and runs assets in order. A single bruin run . executes the full pipeline.
Ingestion

ingest_gtfs_static.py downloads the GTFS ZIP from data.gov.hk, extracts each file, uploads to GCS, and triggers BigQuery load jobs with WRITE_TRUNCATE — so every daily run is a full refresh.
ingest_mtr_csv.py fetches 4 CSVs from the MTR portal. Two gotchas I hit here:
-
The MTR site drops connections without a User-Agent header. Add
User-Agent: Mozilla/5.0to every request. -
MTR CSVs have a UTF-8 BOM character (
\ufeff) at the start. Decode withutf-8-signotutf-8or your column names will be corrupted.
Staging Layer

Five SQL assets clean and standardise the raw data — cast types, rename to snake_case, filter nulls on primary keys. Nothing fancy, just making the data reliable for downstream use.
Example from stg_stops.sql:
SELECT
  CAST(stop_id AS INT64) AS stop_id,
  stop_name,
  CAST(stop_lat AS FLOAT64) AS latitude,
  CAST(stop_lon AS FLOAT64) AS longitude
FROM raw.gtfs_stops
WHERE stop_id IS NOT NULL
Mart Layer

Ten aggregated mart tables power the dashboard. These are always built from staging, never from raw. A few interesting ones:
- mart_peak_hour_analysis — Groups all departures by hour of day to find peak periods
- mart_transfer_hubs — Counts how many distinct routes serve each stop
- mart_weekday_vs_weekend — Compares service volume split by calendar type
- mart_trip_trajectories — Joins trips with stop coordinates to build route paths for map rendering
Streaming Layer
The streaming layer adds real-time MTR train schedule data on top of the batch pipeline.
Producer (Cloud Run Job)
Polls the MTR Schedule API for each configured line, serialises events as JSON, and publishes them to a Redpanda topic (hk-mtr-schedule). It's one-shot — no infinite loop — designed to run as a Cloud Run Job and exit cleanly after publishing.
Consumer (Cloud Run Job)
Reads from Redpanda and writes to BigQuery using streaming inserts. It runs for 50 seconds then exits — a time-bounded window that fits within the 1-minute Cloud Scheduler cadence:
RUN_DURATION = 50
deadline = time.time() + RUN_DURATION

while time.time() < deadline:
    msg = consumer.poll(1.0)
    # process and insert to BigQuery
Why Redpanda instead of Kafka? Redpanda is Kafka-compatible (same Python client), has no ZooKeeper dependency, and the free cloud tier is generous enough for this scale. Zero ops overhead.
CI/CD and Deployment
Keyless Auth with Workload Identity Federation
I used Workload Identity Federation (WIF) for GitHub Actions — no service account JSON keys stored as secrets. The workflow authenticates via OIDC token exchange, which GCP validates against the WIF provider.
The tricky part: when creating the OIDC provider, you must include an --attribute-condition that restricts which GitHub repositories can use it. Without it, GCP rejects the provider:
gcloud iam workload-identity-pools providers create-oidc github-provider \
  --attribute-condition="assertion.repository_owner=='YourGitHubUsername'"
Three Cloud Run Deployments
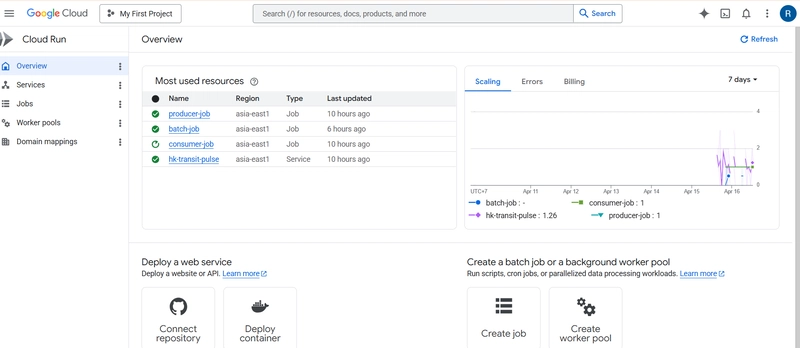
The project deploys three separate workloads:
- Cloud Run Service — Streamlit dashboard, always-on, public URL
- Cloud Run Job (batch-job) — Bruin pipeline, triggered daily at 22:00 UTC (06:00 HKT) by Cloud Scheduler
- Cloud Run Jobs (producer-job + consumer-job) — Streaming pipeline, triggered every minute
All three share the same Artifact Registry but use different Docker images. The dashboard image runs streamlit run dashboard/app.py. The batch image installs Bruin CLI and runs bruin run ..
Bruin in Docker — The Gotchas
Getting Bruin to run inside a Docker container took a few iterations:
-
PATH issue — Bruin's install script puts the binary in
~/.local/bin. AddENV PATH="/root/.local/bin:${PATH}"to the Dockerfile. -
Git repo required — Bruin looks for a git repo root to resolve asset paths. Add
git init && git commitin the Dockerfile. -
.bruin.ymlis gitignored — The config file can't be committed (contains project ID). Create it inline withprintfin the Dockerfile.
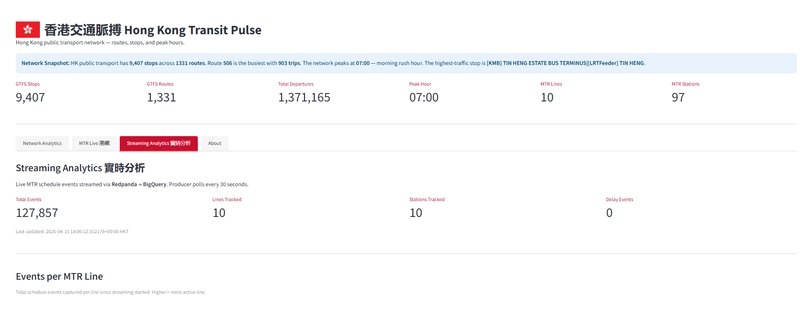
Dashboard
The Streamlit dashboard has 4 tabs:

Network Analytics — GTFS-based charts filtered by transport type:
- Stop locations map (pydeck ScatterplotLayer)
- Top 10 busiest stops by departure count
- Peak hour analysis chart
- Weekday vs weekend service comparison
- Transfer hubs, longest routes, first/last services
MTR Live 港鐵 — MTR station and fare data from the open data CSVs

Streaming Analytics 實時分析 — Real-time event counts from the Redpanda stream, refreshed on demand
About — Project background
One Streamlit bug I hit in production: st.pydeck_chart() throws a SessionInfo error when the session isn't fully initialised — which happens on Cloud Run before the first request completes. The fix is twofold: upgrade to Streamlit 1.45.0 (which patches the underlying bug) and wrap every pydeck_chart() call in a try-except as a belt-and-suspenders fallback.
Infrastructure as Code
All GCP infrastructure is provisioned with OpenTofu (open-source Terraform fork):
- GCS bucket for the data lake
- BigQuery datasets:
raw,staging,marts,streaming - Service account with appropriate IAM bindings
- Artifact Registry for Docker images
One gotcha: BigQuery tables must be manually deleted before tofu destroy — OpenTofu can't drop non-empty tables. Use bq rm -f -t project.dataset.table first.
Key Learnings
1. Bruin is genuinely elegant for combined Python + SQL pipelines. The single-orchestrator approach removes the glue code you'd otherwise write to pass data between ingestion and transformation stages.
2. WIF is the right call over SA keys. No key rotation, no leakage risk, and it fits cleanly into the GitHub Actions OIDC flow. The setup is more involved upfront but it's worth it.
3. Cloud Run Jobs are perfect for one-shot workloads. The producer and consumer aren't servers — they're functions that run, do their work, and exit. Cloud Run Jobs model this naturally, and Cloud Scheduler gives you the cron trigger.
4. MTR's public data coverage has real gaps. No GTFS means no trip-level analysis for the heavy rail network — you can't do headway or crowding analysis with what's available. The streaming layer partially compensates for this, but real-time schedule data isn't the same as historical trip records.
5. GTFS stop_times.txt is large — over 100MB — but BigQuery handles it cleanly via the load job API. No need to chunk it.
6. Watch your query scope. I had a LIMIT 20 on a trips query that was feeding a KPI metric — it showed 16 routes instead of 700+. Always use a separate COUNT(DISTINCT ...) query for aggregate KPIs rather than deriving them from display-scoped queries.
What's Next
A few things I'd improve with more time:
- Real KMB stop IDs for the streaming layer — the bus ETA producer currently uses placeholder stop IDs
-
Historical streaming data — the current setup doesn't persist stream history beyond what's in
mtr_schedule_raw; proper partitioning and retention would make this more useful - dbt instead of raw SQL — Bruin's SQL assets work well but lack some of dbt's testing and documentation features
- Looker Studio or Metabase — Streamlit is fast to build but harder to maintain than a proper BI tool for this kind of analytical dashboard
Try It Yourself
The full project is open source:
GitHub: TBA
Live dashboard: https://hk-transit-pulse-fclvz6lara-de.a.run.app
The README has full reproduction steps — you can clone it, provision your own GCP project with tofu apply, and run the full pipeline locally with a single bruin run.
Built as a capstone project for the Data Engineering Zoomcamp 2026, sponsored by Bruin.
Credit
Cover Image Source by Nick Young on Unsplash


Top comments (0)